Help


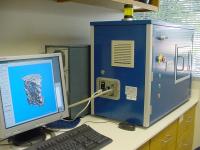
Test Description: The µCT40 scans dissected bones and provides detailed information on bone mass and architecture. Multiple bones are placed into sample holders and scanned automatically. The researcher than uses instrument software to select regions of interest for analysis. Trabecular bone parameters are analyzed in the fifth lumbar vertebrae (LV5) at 16 micrometer resolution and cortical bone parameters are analyzed in the femur midshaft at a resolution of 20 micrometers.


Results
Results
M-99
wt
M-103
wt
M-144
hom
M-155
hom
M-157
hom

Results

Lumbar 5 Vertebra


Midshaft Femur


  MicroCT Data for Project: NIH-0787 - Results        Export Data to Spreadsheet
Mouse
Label
Genotype Age (days) Position Image Thumbnail Movie Sampno Measno VOX-TV VOX-BV VOX-BV/TV Conn-Dens TRI-SMI DT-Tb.N* DT-Tb.Th* DT-Tb.Sp* DT-Tb.(1/N).SD* DT-Tb.Th.SD* DT-Tb.Sp.SD* TRI-TV TRI-BV TRI-BV/TV TRI-BS TRI-BS/BV TRI-Tb.N TRI-Tb.Th TRI-Tb.Sp TRI-DA MeasNumSlices
M-144 hom 82 Femur View 1764 1987 0.4203 0.1686 30.57 0.0 0.665 0.0 0.0 0.0 0.0 0.0 0.0 0.633 0.162 0.255 2.362 14.587 1.865 0.137 0.399 6.646 20
M-144 hom 67 Vertebrae View 1187 1401 0.9484 0.29 30.57 142.3382 -0.0418 2.7435 0.0803 0.4311 0.2695 0.0256 0.2695 0.9156 0.2759 0.3013 7.0036 25.3887 3.8245 0.0788 0.1827 1.326 240
M-155 hom 83 Femur View 1767 1990 0.6669 0.2716 45.98 0.0 0.675 0.0 0.0 0.0 0.0 0.0 0.0 1.018 0.26 0.255 3.06 11.749 1.502 0.17 0.495 4.555 20
M-155 hom 68 Vertebrae View 1188 1402 1.5459 0.7108 45.98 232.23 0.1888 6.6092 0.1131 0.1588 0.0831 0.0685 0.0831 1.4996 0.6918 0.4613 15.713 22.7136 5.2392 0.0881 0.1028 1.5015 240
M-157 hom 83 Femur View 1724 1958 0.7925 0.3503 53.88 0.0 -0.155 0.0 0.0 0.0 0.0 0.0 0.0 1.117 0.336 0.301 3.577 10.621 1.601 0.188 0.436 3.218 20
M-157 hom 76 Vertebrae View 1507 1728 1.3555 0.7303 53.88 125.7857 -0.4676 5.6626 0.1496 0.1506 0.0794 0.0656 0.0794 1.3105 0.7189 0.5486 12.1829 16.9468 4.6483 0.118 0.0971 1.5267 298
F-86 wt 157 Femur View 1700 1923 0.8267 0.4626 0.0 1.383 0.0 0.0 0.0 0.0 0.0 0.0 1.253 0.44 0.351 3.178 7.213 1.268 0.277 0.511 10.732 20
M-99 wt 95 Femur View 1750 1973 0.9092 0.4986 29.52 0.0 0.701 0.0 0.0 0.0 0.0 0.0 0.0 1.215 0.475 0.391 3.433 7.218 1.412 0.277 0.43 7.699 20
M-99 wt 90 Vertebrae View 1517 1713 3.6106 1.0657 29.52 213.6787 0.8424 5.3029 0.064 0.1932 0.1044 0.0209 0.1044 3.515 1.0249 0.2916 36.5233 35.635 5.1954 0.0561 0.1364 1.6102 298
M-103 wt 94 Femur View 1699 1922 0.8272 0.4401 26.95 0.0 1.308 0.0 0.0 0.0 0.0 0.0 0.0 1.09 0.419 0.384 3.166 7.547 1.452 0.265 0.423 11.887 20
M-103 wt 90 Vertebrae View 1550 1776 2.6979 0.727 26.95 141.5925 1.1024 4.6085 0.0665 0.2208 0.1188 0.0207 0.1188 2.6254 0.6933 0.2641 23.3205 33.6363 4.4412 0.0595 0.1657 1.8585 298


Copyright 2005 by Lexicon Genetics Incorporated
Lexicon Phenotypic Analysis software version 05.05.00.05