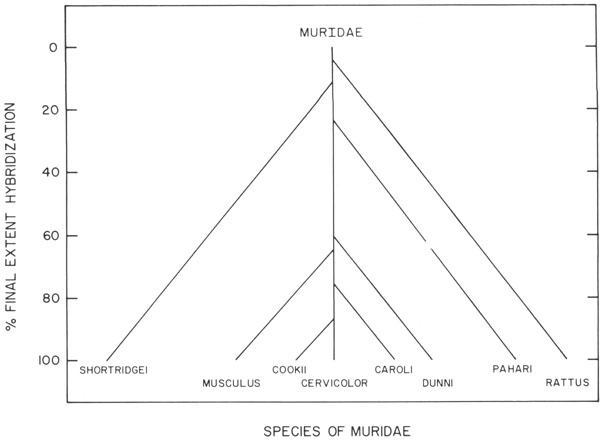
FIGURE 1. Phylogenetic tree depicting relationships among members of the family Muridae. The final extents of hybridization shown in Table 2 are depicted diagramatically. The distance between divergent lines represents differences in nucleic acid homology which is dependent on hybridization conditions and not relative times of divergences from a common ancestor.