 |
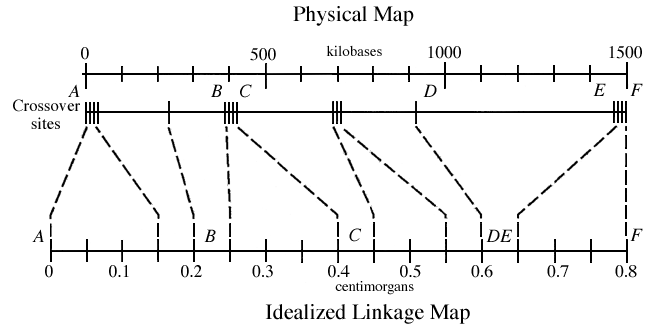
| Figure 7.5 The effects of recombination hotspots on the relationship between linkage and physical maps. Corresponding physical and linkage maps for a hypothetical genomic interval extending over six loci — A, B, C, D, E and F. The linkage map is based on the analysis of 2,000 backcross offspring. Thus, the recombination fraction separating adjacent crossover events is 1/2,000 or 0.0005, which is equivalent to a linkage distance of 0.05 cM. Vertical lines on the linkage map represent the individual crossover events separated by this idealized distance. Vertical lines on the physical map represent the corresponding location of each crossover event within the DNA molecule. Hotspots are defined operationally by the clustering of crossover events — near locus A, between B and C, halfway between C and D, and between E and F. |