 |
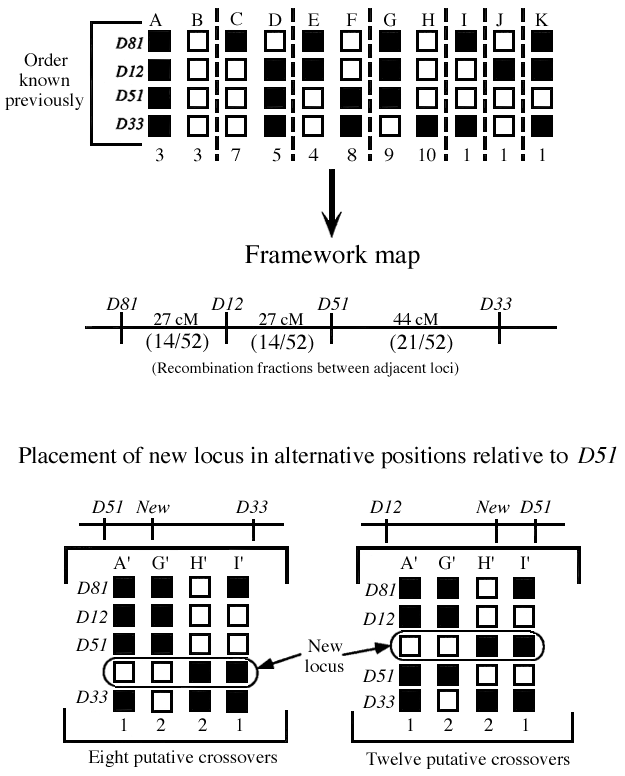
| Figure 9.15 Haplotype analysis of backcross data. Illustration of the approach used to map a new locus relative to marker loci typed in a backcross. At the top, haplotypes are shown for the marker loci on one chromosome, which is determined to show evidence of linkage to the new locus under analysis. These haplotypes allow the generation of the framework map shown in the middle of the Figure. Recombination fractions derived directly from the haplotype data are indicated under the framework map. These fractions have been converted into centimorgan distances with the Carter-Falconer mapping function (Equation 7.3). At the bottom, recombinant haplotypes are shown only for mice with crossover events between the new locus and the linked D51 locus. |