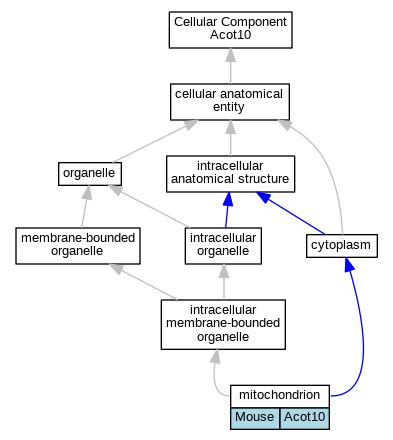
Comparative GO Graph (mouse, human, rat, zebrafish)
Compare experimental GO annotations for Human-Mouse-Rat-Zebrafish orthologs to Mouse Acot10
Graphs display curated GO classifications for mouse, human, rat and zebrafish orthologs annotated from the biomedical literature.
- This class contains
- Human genes ACOT9
- Mouse genes Acot10
- Rat genes Acot9
- Zfish genes acot9.1,acot9.2
- Annotations are indicated with nodes colored by organism:
Human,
Mouse,
Rat,
Zfish
- Relations between GO terms are indicated by colored edges "is_a"; "part_of"; "regulates"; "positively_regulates"; "negatively_regulates"
- GO annotations: Human from GOA; Mouse from MGI; Rat from RGD; Zebrafish from ZFIN.
- Only experimental annotations are displayed: EXP, IDA, IEP, IGI, IMP, IPI, HTP, HDA, HMP, HGI, HEP. Evidence codes are listed at the bottom of the page.


 Full set of experimental annotations for Human-Rat-Zebrafish genes considered orthologs of Mouse in the Alliance stringent orthology set Acot10
Gene Ontology Evidence Code Abbreviations:
| EXP Inferred from experiment |
| IDA Inferred from direct assay |
| IEP Inferred from expression pattern |
| IGI Inferred from genetic interaction |
| IMP Inferred from mutant phenotype |
| IPI Inferred from physical interaction |
| HTP Inferred from High Throughput Experiment |
| HDA Inferred from High Throughput Direct Assay |
| HMP Inferred from High Throughput Mutant Phenotype |
| HGI Inferred from High Throughput Genetic Interaction |
| HEP Inferred from High Throughput Expression Pattern |
 Analysis Tools


